ISeeChange
One design system and a redesigned product across a city dashboard and two citizen apps, for a climate resilience startup.After the website and brand overhaul, B2B leads rose 20%.
+20%
B2B leads after the website and brand overhaul
85%
report completionup from 80%
80%
signup conversionup from 70%
- Role
- Freelance product designer (current client)
- Platforms
- Web, iOS, Android
The problem
ISeeChange turns citizen reports of flooding and extreme heat into data that cities and utilities can act on.
It had two audiences with different needs, and a product that looked and behaved like two.
City officials needed a dense tool they could trust, and citizens needed a way to report that was quick enough to actually finish.
The calls
Map the dashboard
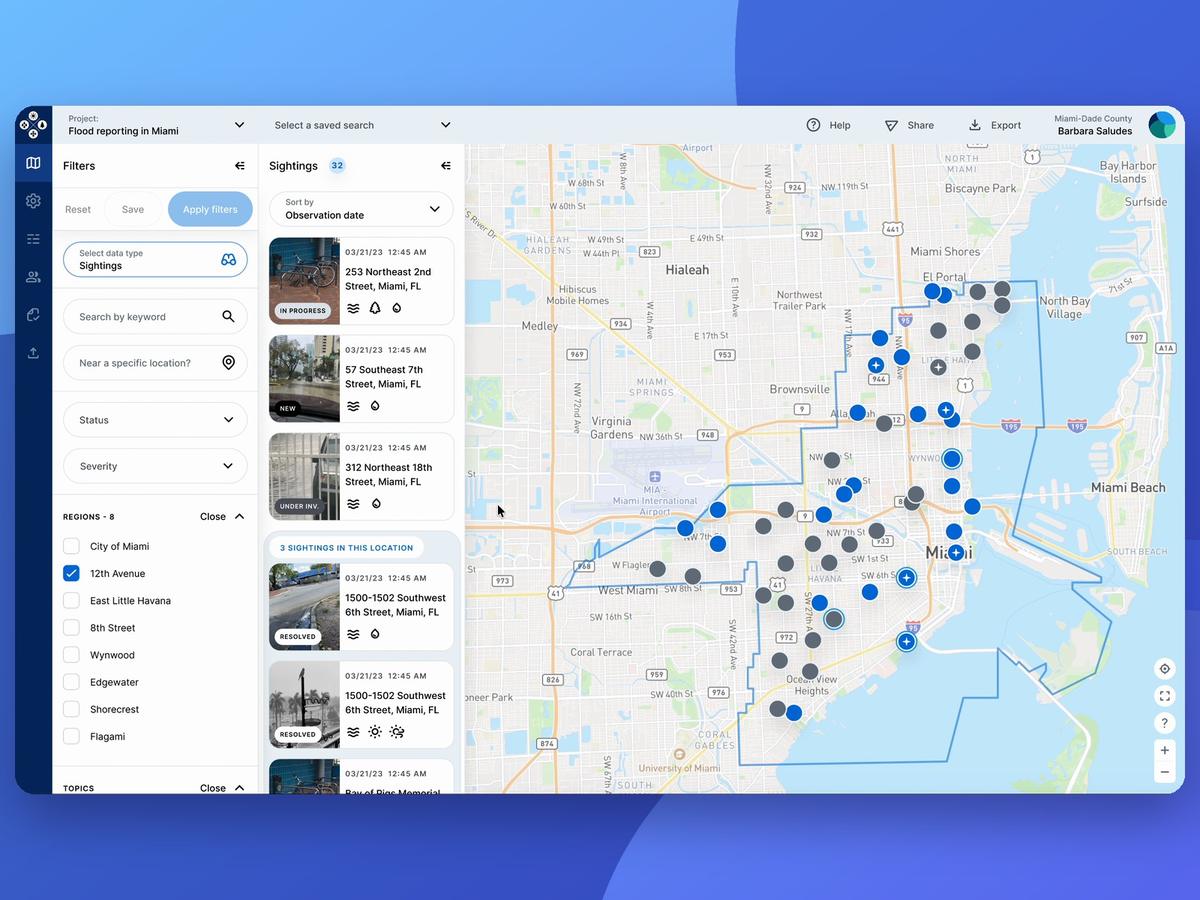
The Customer Dashboard was my most complex project at ISeeChange, a map-based tool that helps cities and utilities explore citizen climate data.
To manage that complexity, I designed a layered sitemap and navigation that could handle map and list views without overwhelming users.
Navigation
A main menu, a filter panel and view controls to switch between sightings, sensors and user data.
Filters narrow the data by region, time, status, severity, topics and groups.
Prototype and test
We turned the mockups into interactive prototypes and tested them with officials from the City of Miami, Miami-Dade County and New Orleans.
Those sessions showed which features and workflows held up in the real world.
Final designs
The sessions shaped which features mattered most and how easily people could navigate the platform.
From there I pulled every tested element into a clean, responsive interface.
Before and after
Listen to users
Beyond the dashboard, I ran qualitative interviews with active users to uncover pain points.
Those insights shaped new posting and tracking flows that matched real behavior.
Guided posting
To fix inconsistent, low-detail reports, we designed FloodTracker and HeatTracker, guided flows for flooding and extreme heat.
Completion among people who start a climate report rose from 80% to 85%.
Redesign the apps
The same insights led to a broader redesign of the apps and websites.
We simplified the navigation, the post creation and sharing, and made everything easier and more understandable.
Fix the signup
I used Mixpanel and Hotjar to move past assumptions, and they helped me isolate a friction point in the signup flow.
We designed an A/B test around one-time codes, with passwords kept as a secondary option.
Conversion rose from 70% to 80%, and errors and drop-offs fell.
One design system
I set up, structured and maintained the design system from zero.
It kept the experience consistent across the apps, the websites and the customer platform.
Partner portal
I designed and launched a partner portal in Webflow that explains the platform\'s value and makes it easy to get in touch.
With the brand overhaul, B2B leads rose 20%.
Results
- 20% more B2B leads after the website and brand overhaul
- Climate report completion up from 80% to 85% among people who start one
- Signup conversion up from 70% to 80% with one-time codes, tested in an A/B test
- A 0-to-1 design system shared by B2B and B2C products
What I learned
The dashboard is only as good as the reports behind it.
Fixing the citizen flows mattered as much as designing the city tools.